1.5 Years
NDA • MaaS
Monitoring and management platform for crypto-mining devices. It helps operators track device performance, react to incidents, manage infrastructure, and monitor profitability remotely.
Domain
Time
My role
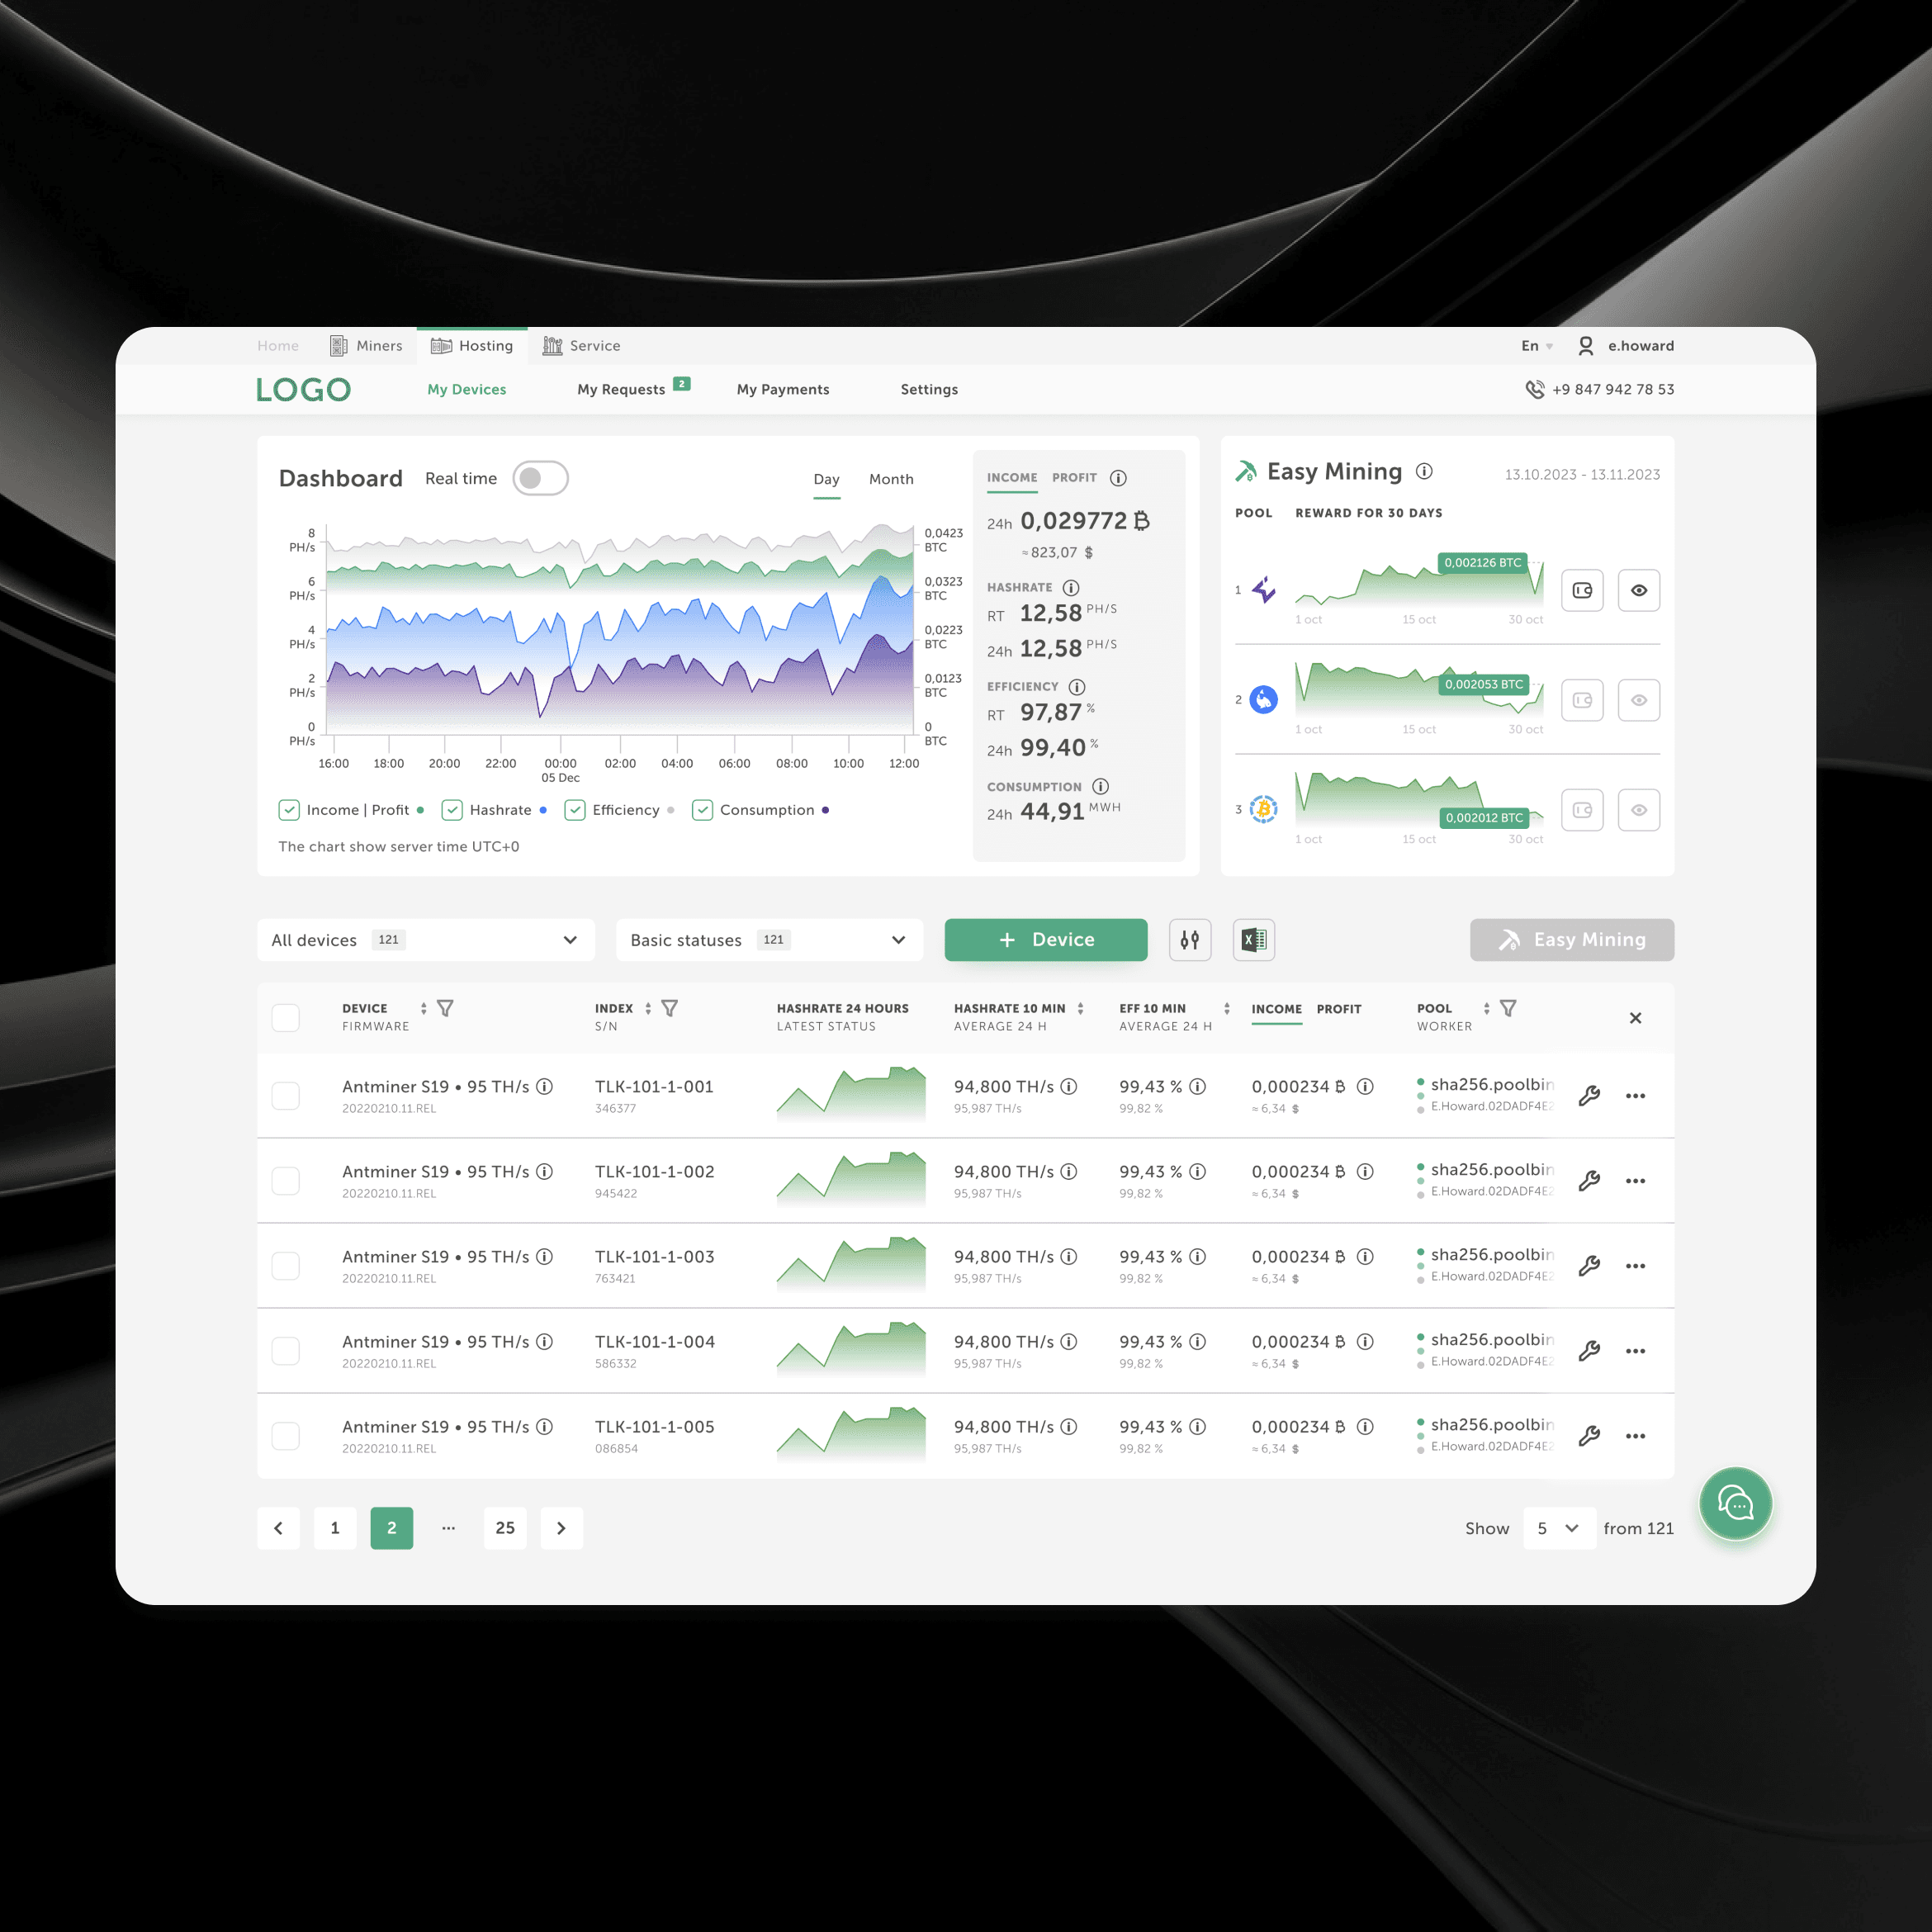
Users relied heavily on customer support for tasks they could technically complete inside the platform. Interviews later showed that the main issue was not missing functionality, but low confidence: the interface was dense, important information was difficult to scan, and users were afraid that a wrong action could lead to costly mistakes.
Increase user confidence and self-service by making device monitoring easier to understand, reducing the risk of mistakes, and helping operators react to problems faster without depending on support.
Results
The redesign contributed to a 20% reduction in support requests by enabling users to handle more routine monitoring and troubleshooting tasks independently. It also removed several sources of operational friction: - automated payment calculations and billing that had previously been handled manually by the company’s accounting team; - made it faster to locate and investigate individual devices through serial-based identification, targeted filtering, and historical data; - reduced reliance on constant dashboard monitoring with in-product and Telegram alerts for critical events; - moved pool profitability comparison into the platform instead of requiring external research; - enabled key monitoring and incident-response scenarios from mobile.
My role
I led UX research and product design for several key improvements to the monitoring experience. I conducted user interviews, synthesized findings, prioritized opportunities with the team, designed and validated new workflows, and worked with product and development through implementation.
Understanding why users avoided self-service
The team already had quantitative data showing how users interacted with the platform, but it could not explain why many of them still preferred contacting support.
I conducted five one-hour interviews with active users to understand their daily monitoring routines, how they handled incidents, which parts of the platform they trusted, and where they preferred to rely on support instead.
The interviews shifted the problem from “users need more functionality” to “users need more confidence and clearer information to use the functionality that already exists.”
Turning research into product opportunities
Several patterns appeared consistently across the interviews:
• fear of costly mistakes made users hesitant to act without support;
• the device table was difficult to scan and did not fully match how operators identified equipment in real life;
• critical events could be missed because information was spread across different parts of the experience;
• new users lacked enough contextual guidance to confidently navigate a dense technical interface;
• operators wanted faster access to information that directly affected uptime and profitability.
I mapped these findings using a Value Proposition Canvas to connect user jobs, pains, and gains with concrete product opportunities. This helped separate high-value improvements from ideas that added functionality without solving a meaningful user problem.

Keeping the team aligned on the core user
The interviews revealed a clear core user profile: an experienced operator responsible for a large number of devices, highly sensitive to downtime, profitability, and maintenance costs.
I captured this as a focused persona to keep product discussions grounded in the same operational reality: users needed the system to surface problems quickly and support confident decisions, not add more information for them to process manually.

Prioritizing what would create the most value
Research produced more improvement opportunities than the team could implement at once. Together with product and engineering, I used ICE scoring to compare ideas by expected impact, confidence, and implementation effort.
This helped us move from a broad list of UX issues to a focused set of improvements that could reduce support dependency, speed up monitoring, and improve incident response.

Automating a manual billing process
The company’s accounting team manually calculated upcoming charges and prepared invoices for customers, creating repetitive operational work and leaving room for calculation errors.
I designed a payment schedule that automated these calculations and presented upcoming payments to customers as a clear timeline. This reduced manual work for the accounting team while giving users a more transparent view of what they needed to pay and when.

Making device monitoring faster to scan
The device table was one of the most frequently used parts of the product, but it did not reflect how operators actually identified and investigated equipment.
During interviews, 80% of users referred to devices primarily by serial number. I reorganized the table around this mental model and revised the information hierarchy so the data needed for everyday monitoring was easier to identify and compare.
I also introduced more targeted filtering and easier access to historical device data, making individual devices faster to locate and investigate during troubleshooting.

Helping users act with confidence
New users often felt lost in the dense interface and were unsure what would happen after certain actions.
I introduced contextual guidance around key workflows so users could get help at the moment it was needed instead of relying on support or separate documentation.
This reduced uncertainty without adding more permanent UI to an already information-heavy product.

Making critical events harder to miss
Operators needed to react quickly when device performance changed, but critical events were easy to miss when monitoring depended on repeatedly checking the platform.
I designed a centralized notification experience and extended critical alerts to Telegram, reducing users’ reliance on constant dashboard monitoring and allowing important events to reach them outside the platform.

Bringing profitability decisions into the product
Choosing a mining pool directly affected profitability, but comparing alternatives required users to research data outside the platform.
I designed a ranked view of available pools using profitability metrics so operators could compare options in the same context where they managed their devices.
This moved pool selection from an external research task into the product itself.

Results
The redesign contributed to a 20% reduction in support requests by enabling users to handle more routine monitoring and troubleshooting tasks independently.
It also removed several sources of operational friction:
• automated payment calculations and billing that had previously been handled manually by the company’s accounting team;
• made it faster to locate and investigate individual devices through serial-based identification, targeted filtering, and historical data;
• reduced reliance on constant dashboard monitoring with in-product and Telegram alerts for critical events;
• moved pool profitability comparison into the platform instead of requiring external research;
• enabled key monitoring and incident-response scenarios from mobile.
Conclusion
This project changed how I approach complex product problems. Instead of starting from interface improvements, I learned to first understand why users behave the way they do, connect research findings to business impact, and prioritize solutions before moving into UI.
It also reinforced an important principle for data-heavy products: adding more information does not necessarily make a system more useful. The designer’s job is often to decide what deserves attention, what can remain secondary, and how to help users act with confidence.

